- Published on
Caddy: Monitoring with Grafana and Prometheus
- Authors

- Name
- Alex Lee
- Title
- CEO
- @alexjoelee
Welcome back! Let's examine using Prometheus and Grafana to monitor Caddy. Refer to the Caddy Documentation for Metrics
Get Started
What are metrics?
Metrics are simply numerical measurements that tell you what your software is doing. Think of 'em as the gauges on a dashboard. They show you things like how busy your application is, how much memory it's using, or how fast it's responding to requests. We collect these to understand performance and spot trouble.
What is Prometheus?
Prometheus is a powerful, open-source monitoring and alerting toolkit. It operates by pulling metrics from configured targets at specified intervals, evaluating rule expressions, displaying the results, and can trigger alerts if some condition is observed to be true. It's often at the core of a system that needs to keep a close watch on its operational health.
Prometheus runs on a server and generates requests to compatible Prometheus metrics endpoints. Caddy offers this out-of-the-box with the metrics directive.
What is Grafana?
Grafana is an open-source platform for monitoring and observability. It allows users to query, visualize, alert on, and explore their metrics, logs, and traces. It can be connected to data sources like Prometheus to take those raw metrics and turn them into easy-to-understand dashboards, making it simple to see the state of an application or infrastructure at a glance.
Installing Grafana and Prometheus
We're not going to get into the installation process in this post, since it's really well-documented on other sites, and very easy:
Configuring Prometheus
Here's what our Promtheus configuration looks like, you can see it's pretty simple:
global:
  scrape_interval:     15s # By default, scrape targets every 15 seconds.

scrape_configs:
  # The job name is added as a label `job=<job_name>` to any timeseries scraped from this config.
  - job_name: 'caddy'
    static_configs:
      - targets: # The list below must be resolvable by your Prometheus host, or you can use an IP address, and additionally you can include a port number, e.g. myserver-1.local:9000
        - 'us-chi-51'
        - 'us-nyc-41'
        - 'us-mia-51'
        - 'us-sea-51'
Connecting Grafana to Prometheus
In the Grafana UI sidebar, select Data Sources then select "Add a New Data Source"
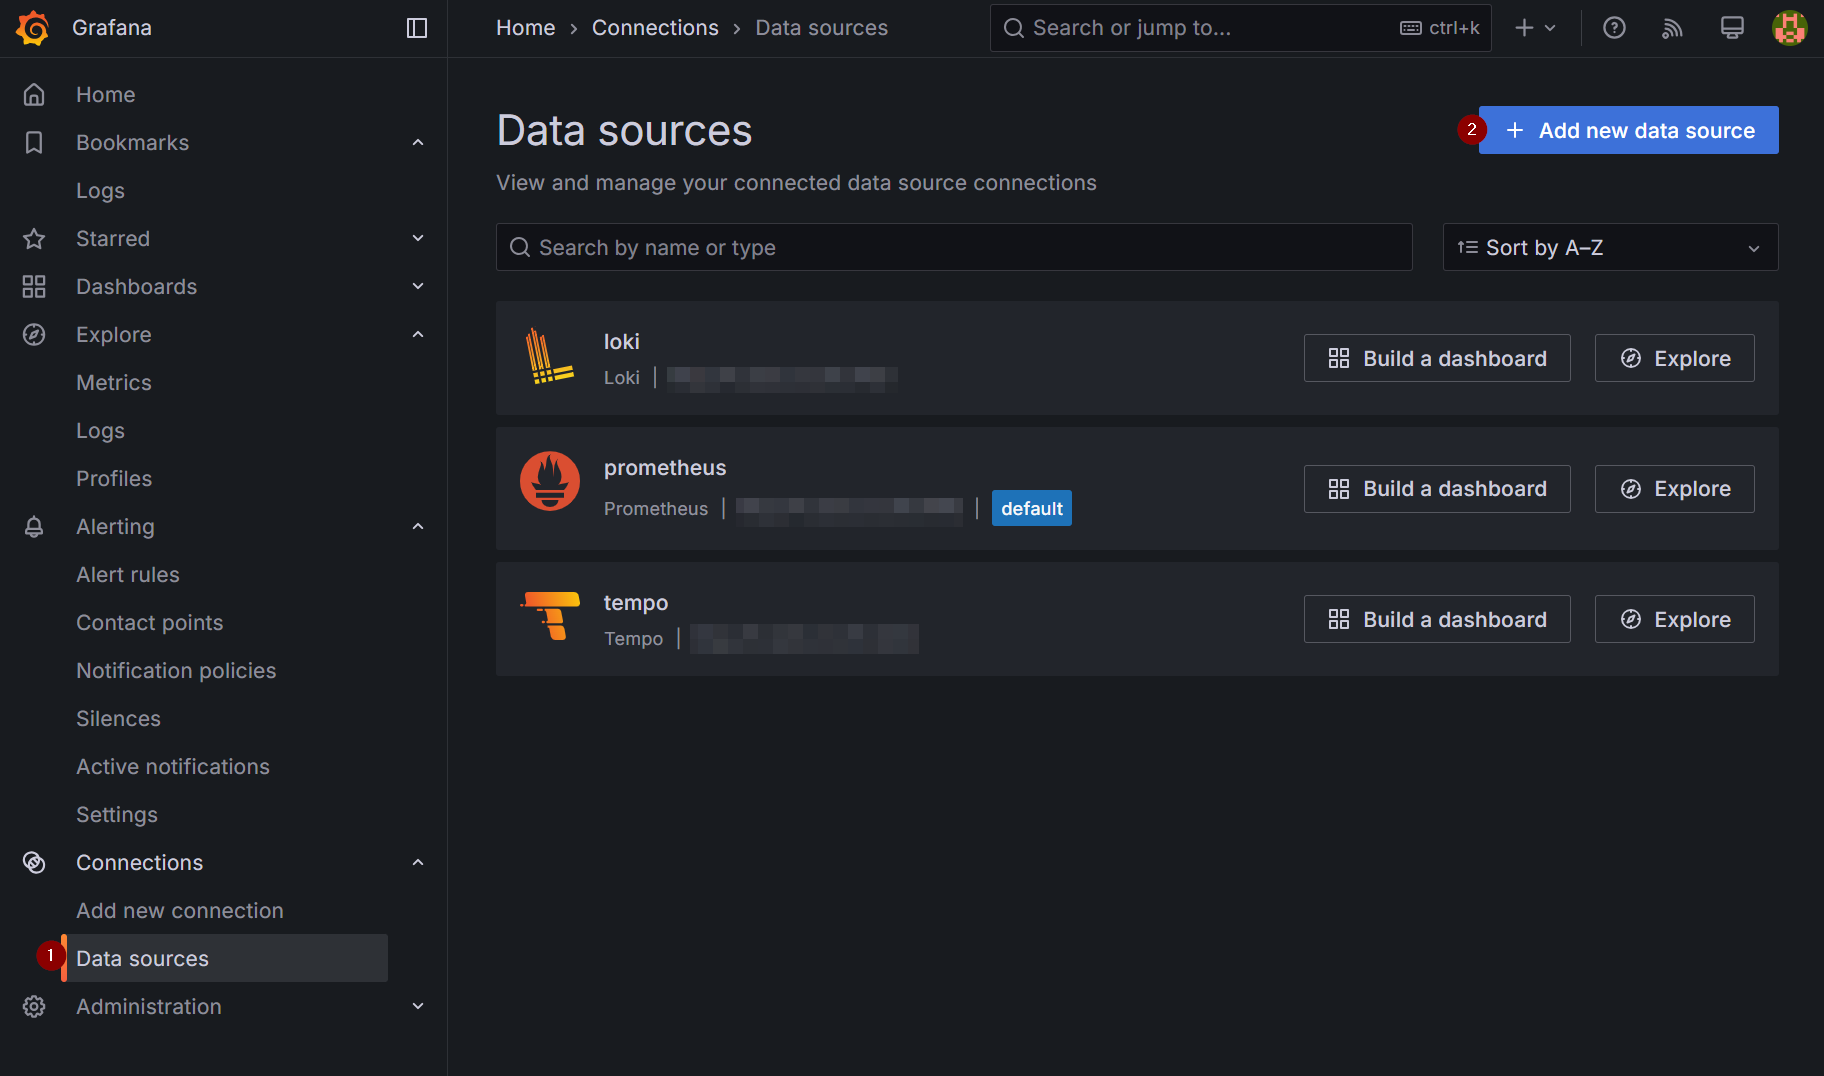
On the following page, you'll be prompted to enter a Data Source name, server FQDN or IP address and port, and optional additional information.
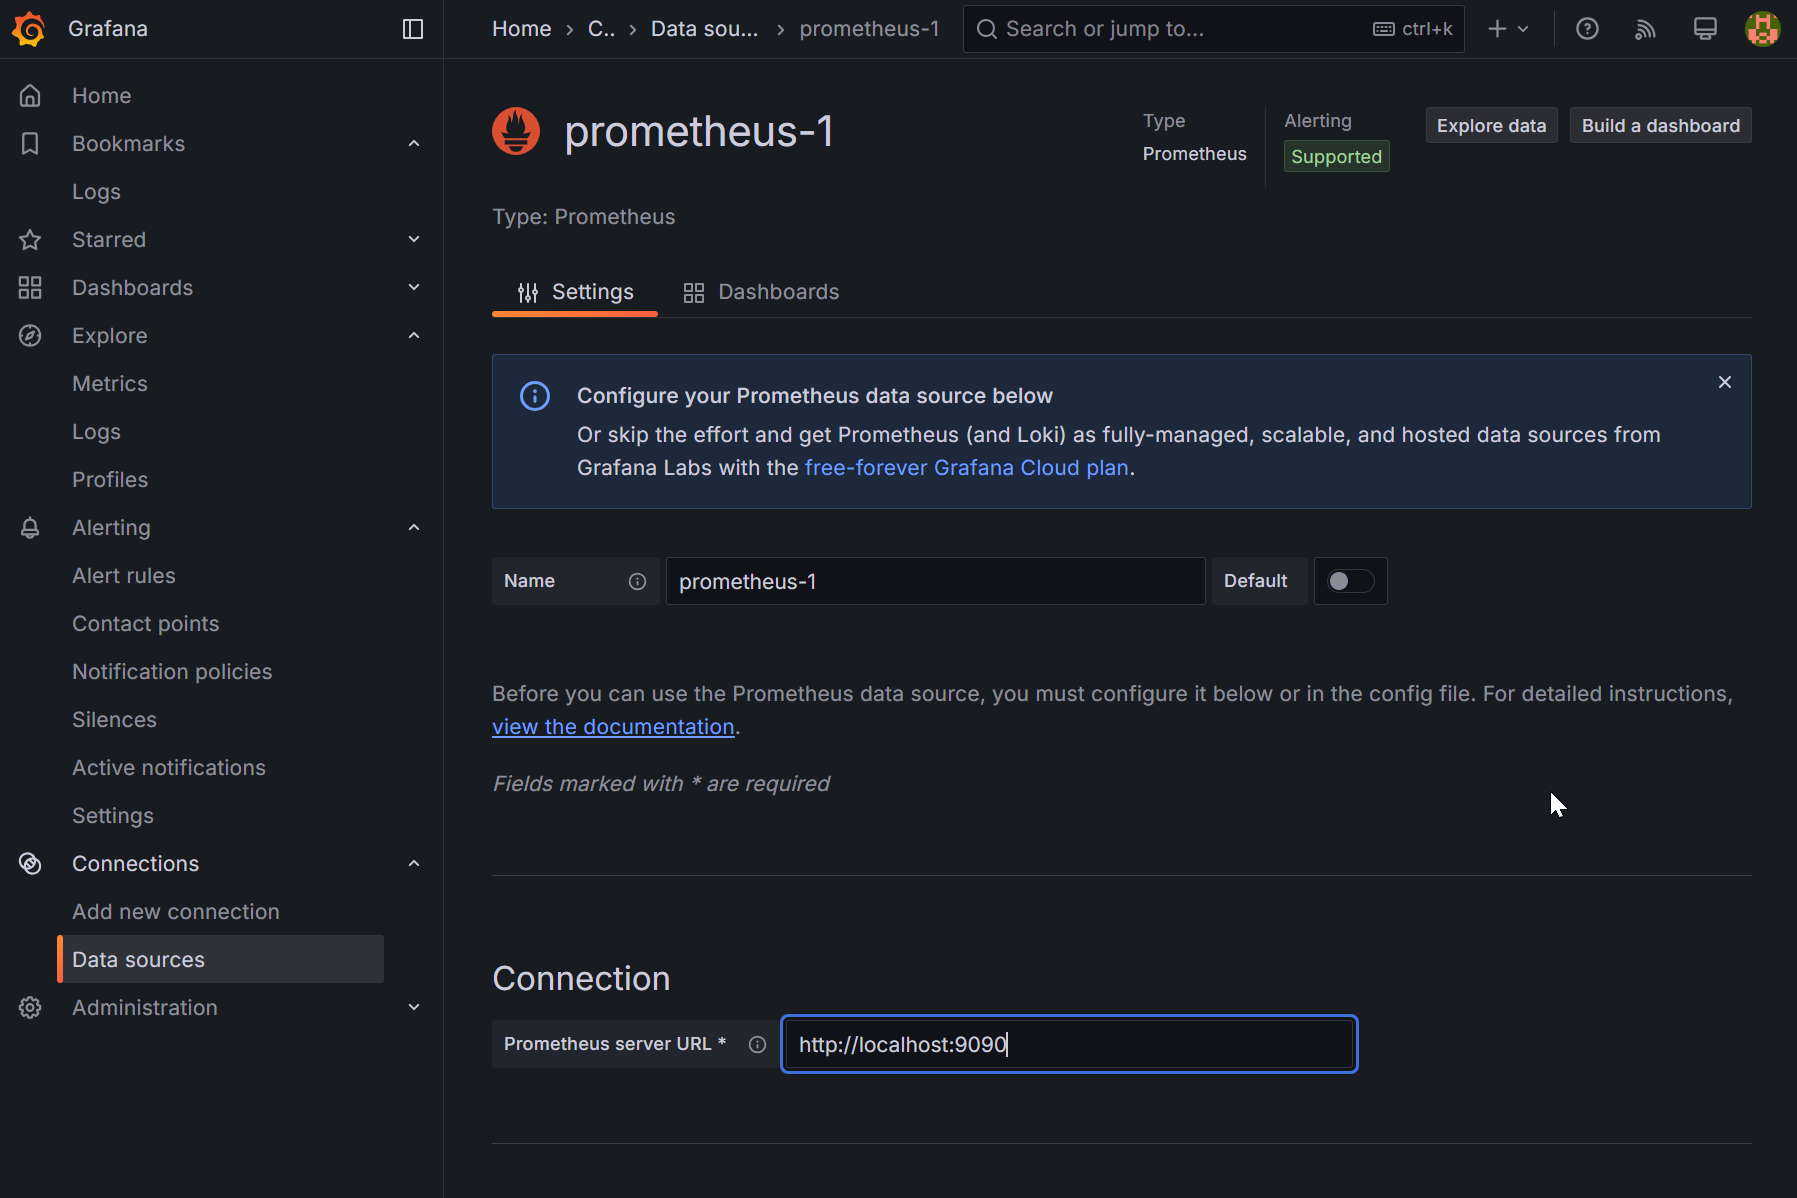
At the bottom of the page, select "Save & test" to verify your Grafana instance can communicate with your Prometheus instance.
Scraping Caddy with Prometheus
In the Caddyfile, we need to enable metrics in our Global options
{
	metrics
}
You also have the option to enable per_host metrics, which will allow you to filter your dashboard data per requested hostname (website):
To enable per_host metrics, simply modify your Global options again:
{
	metrics {
		per_host
	}
}
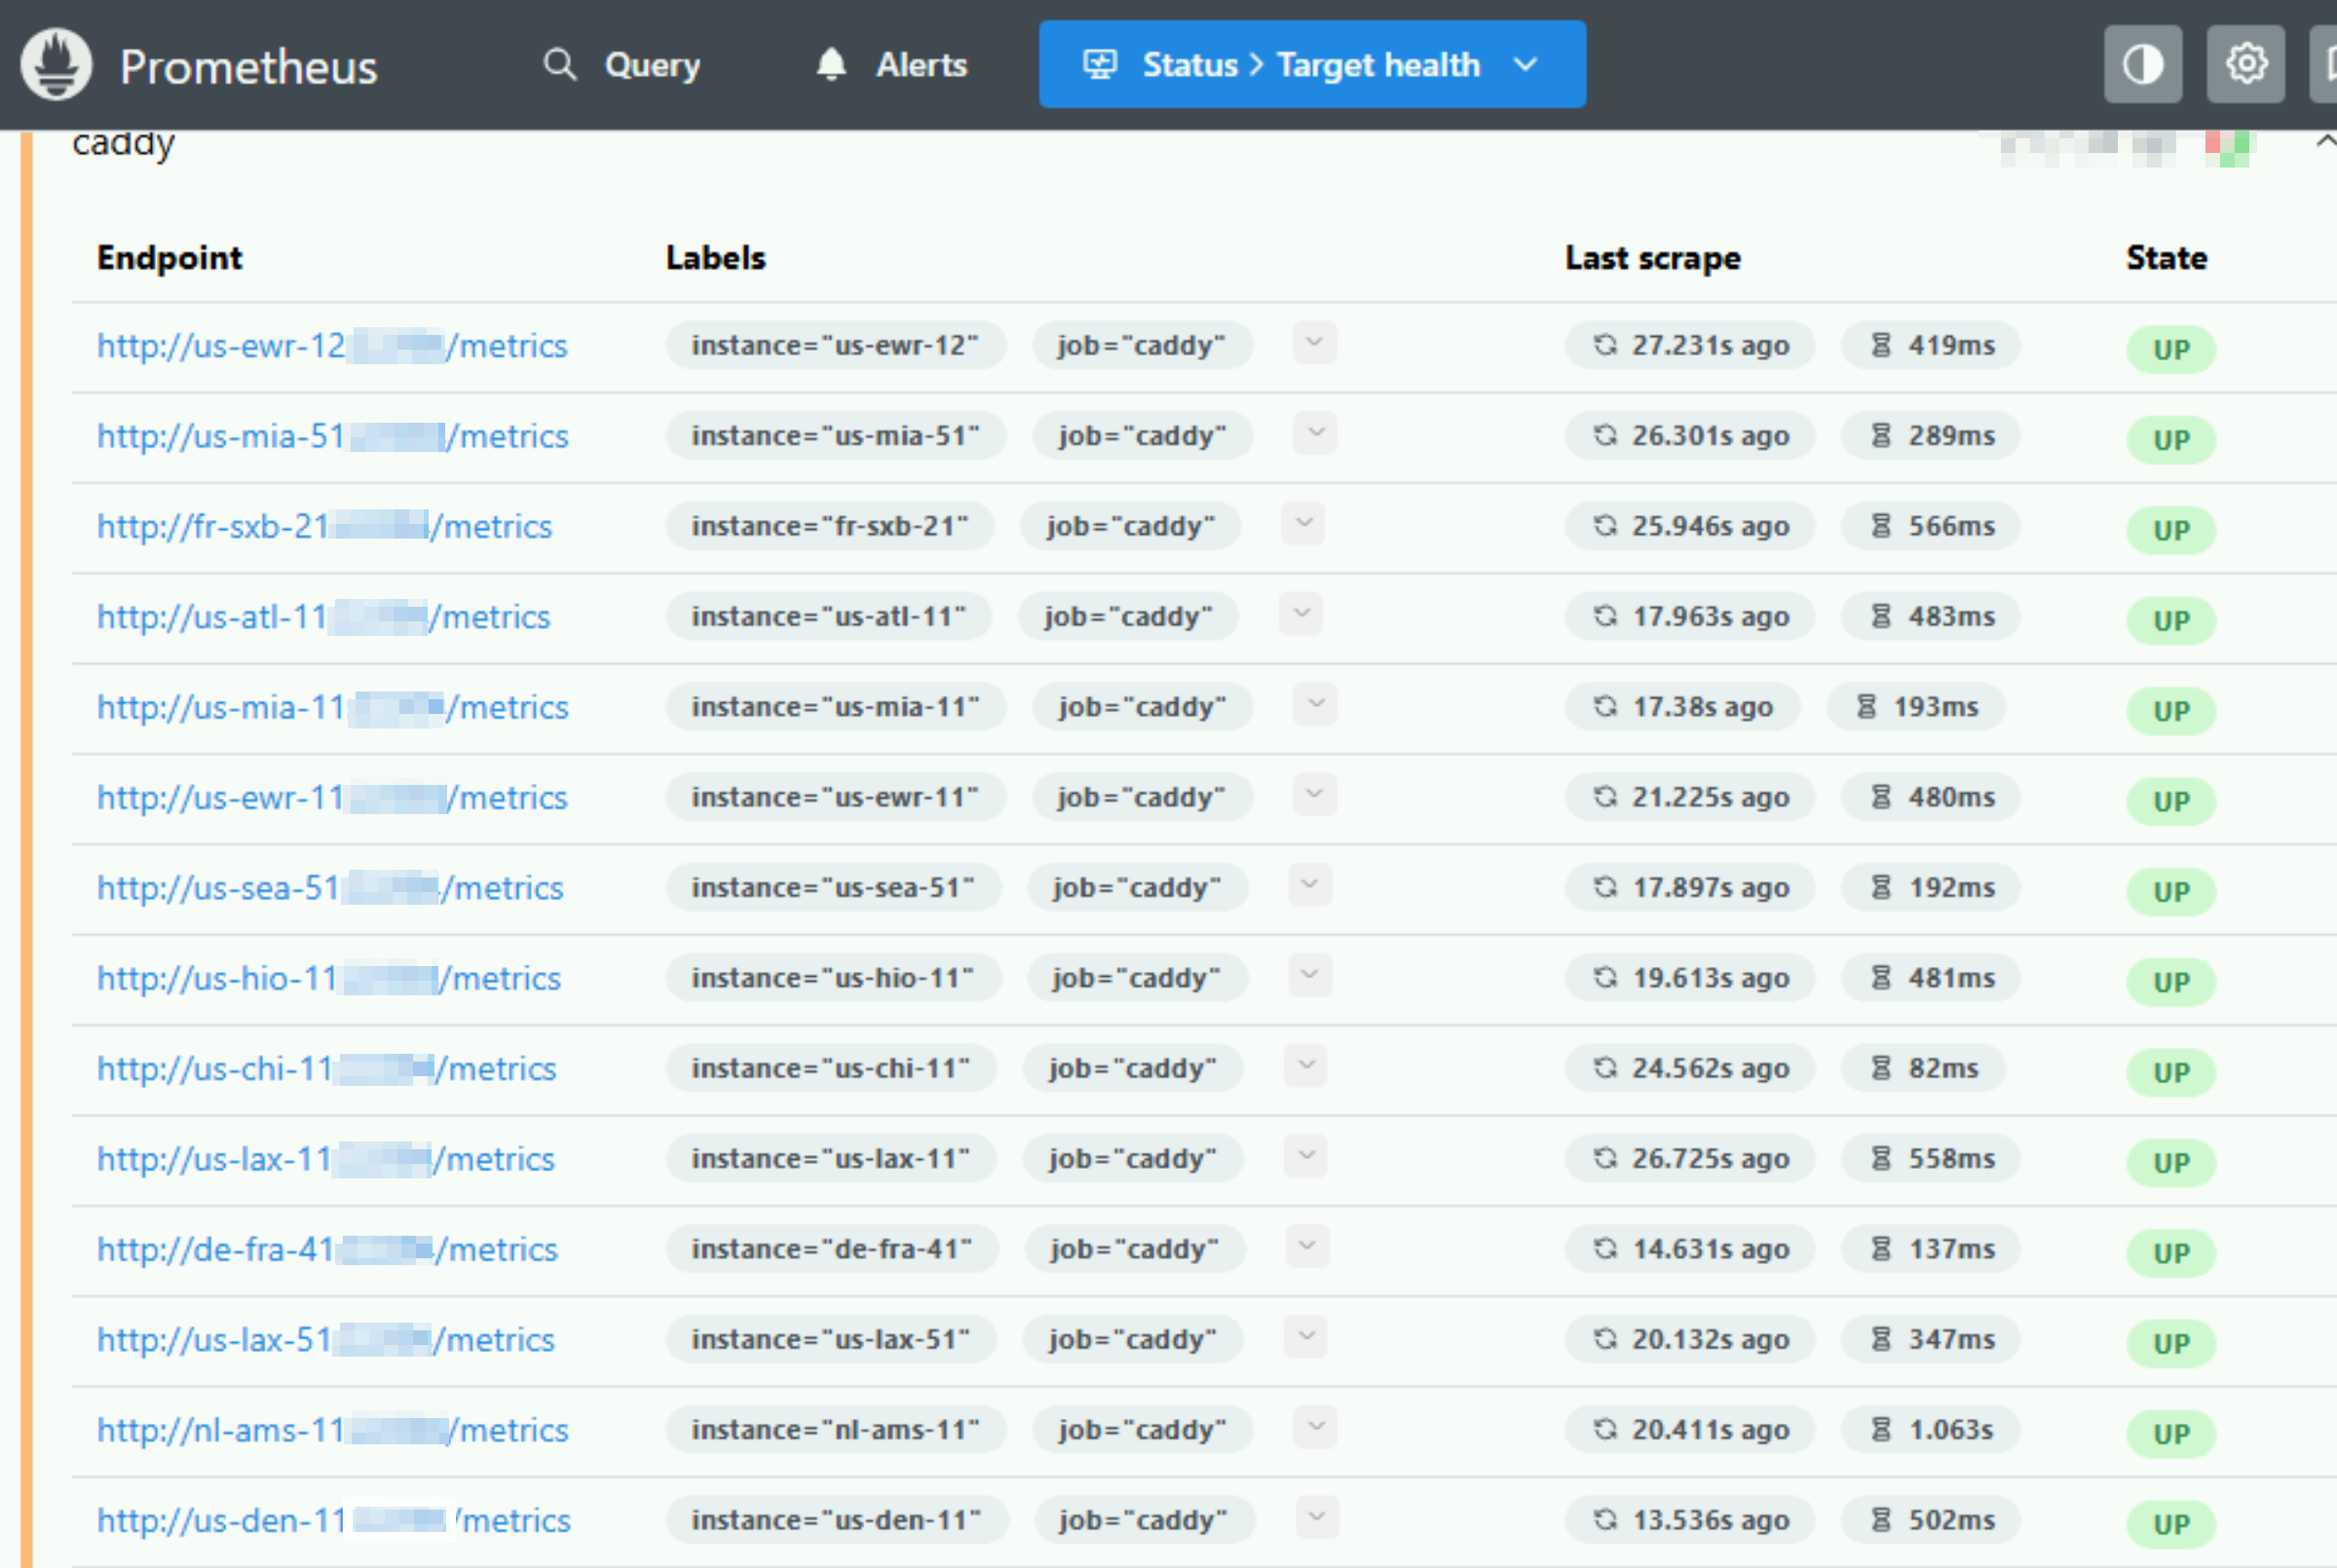
That's it! If you check your Prometheus instance, you should see up status:
Making some Dashboards
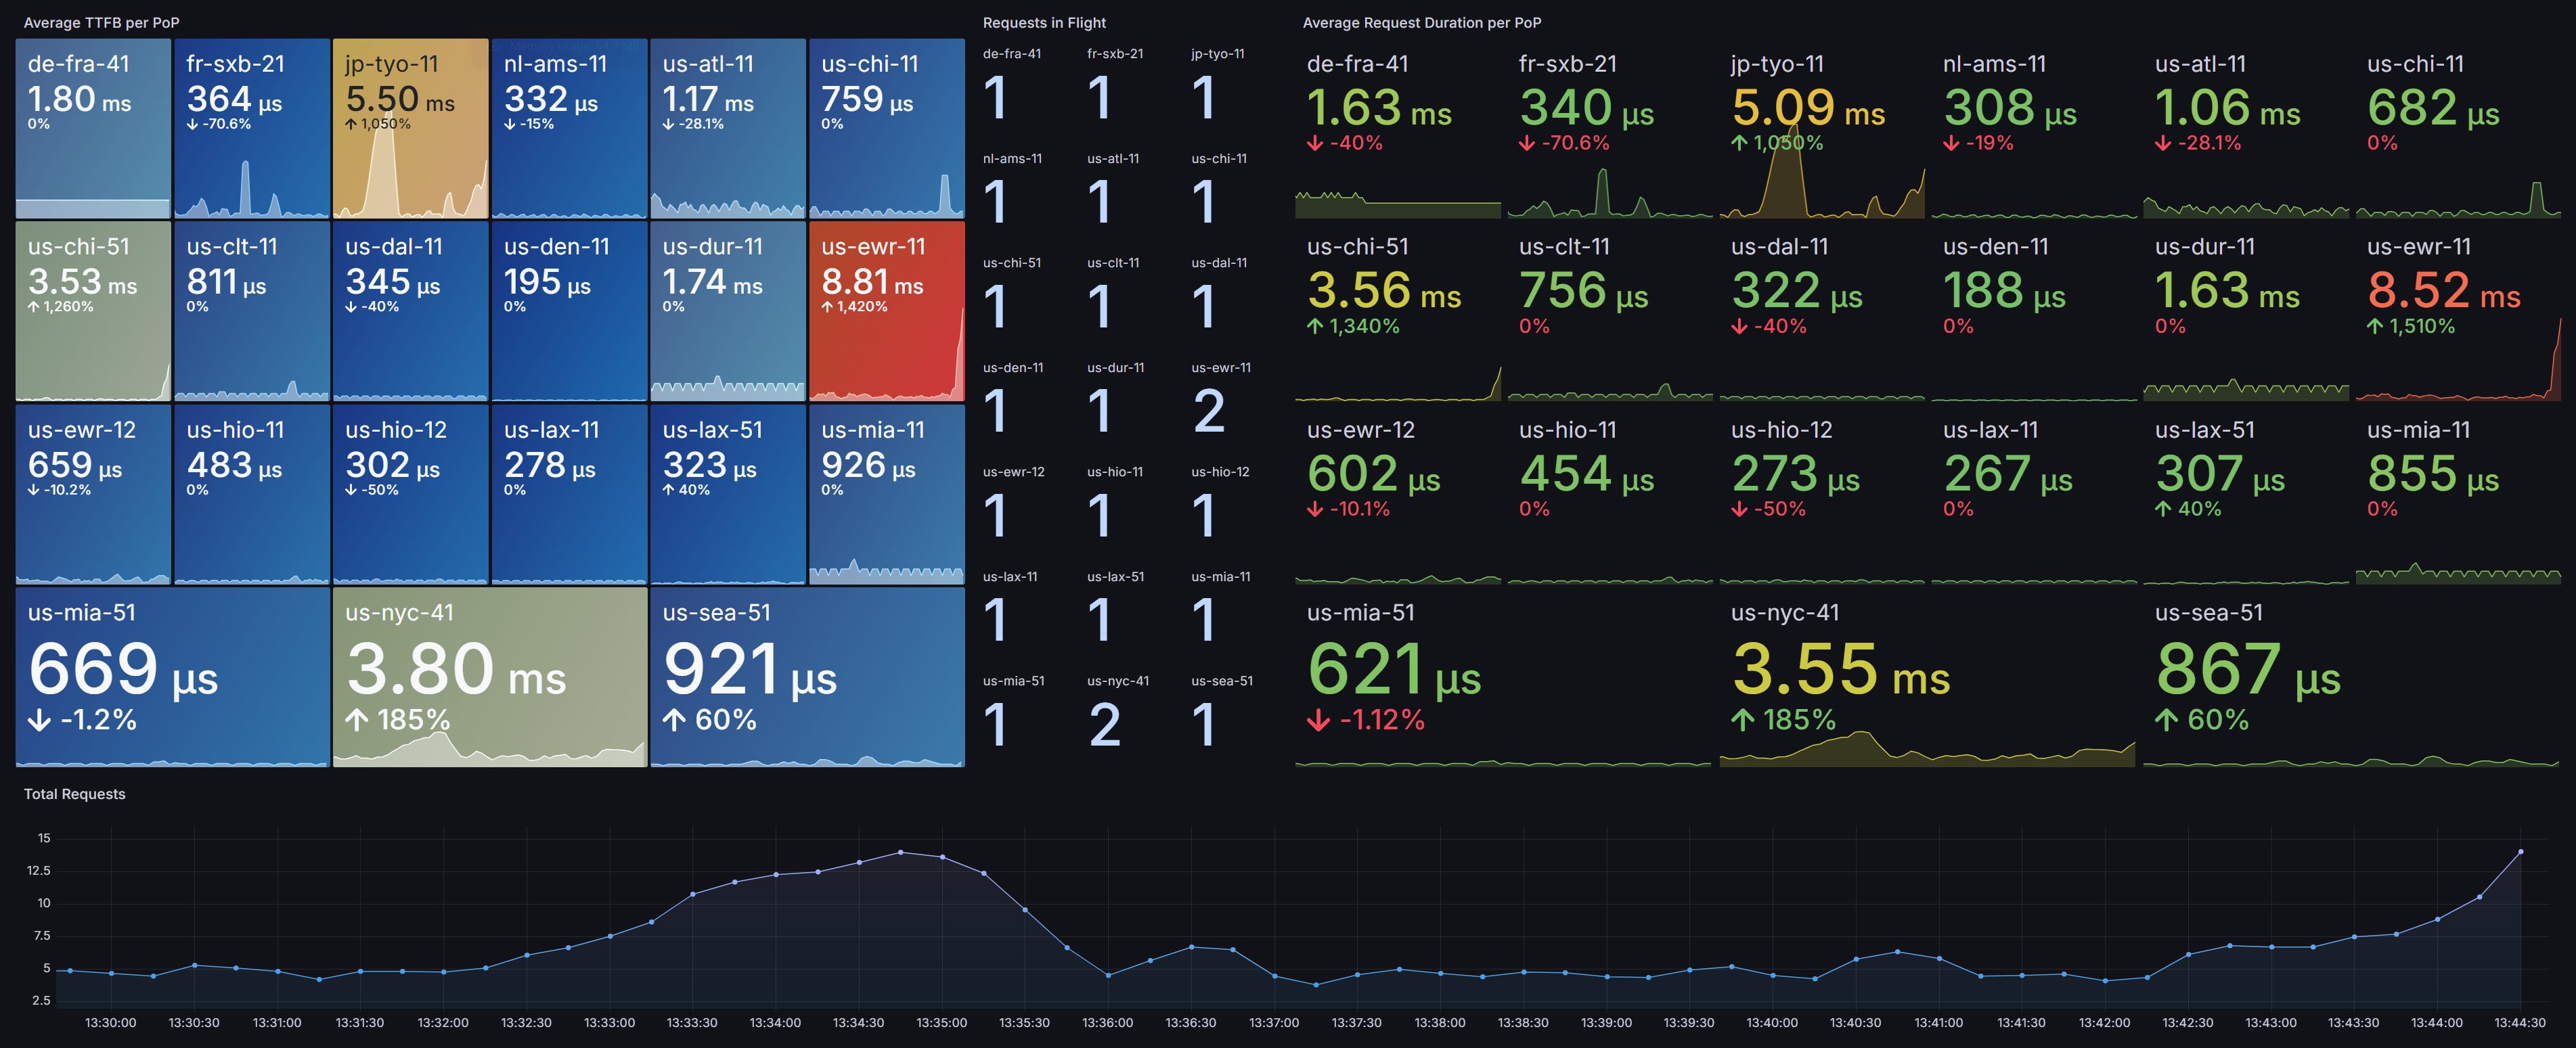
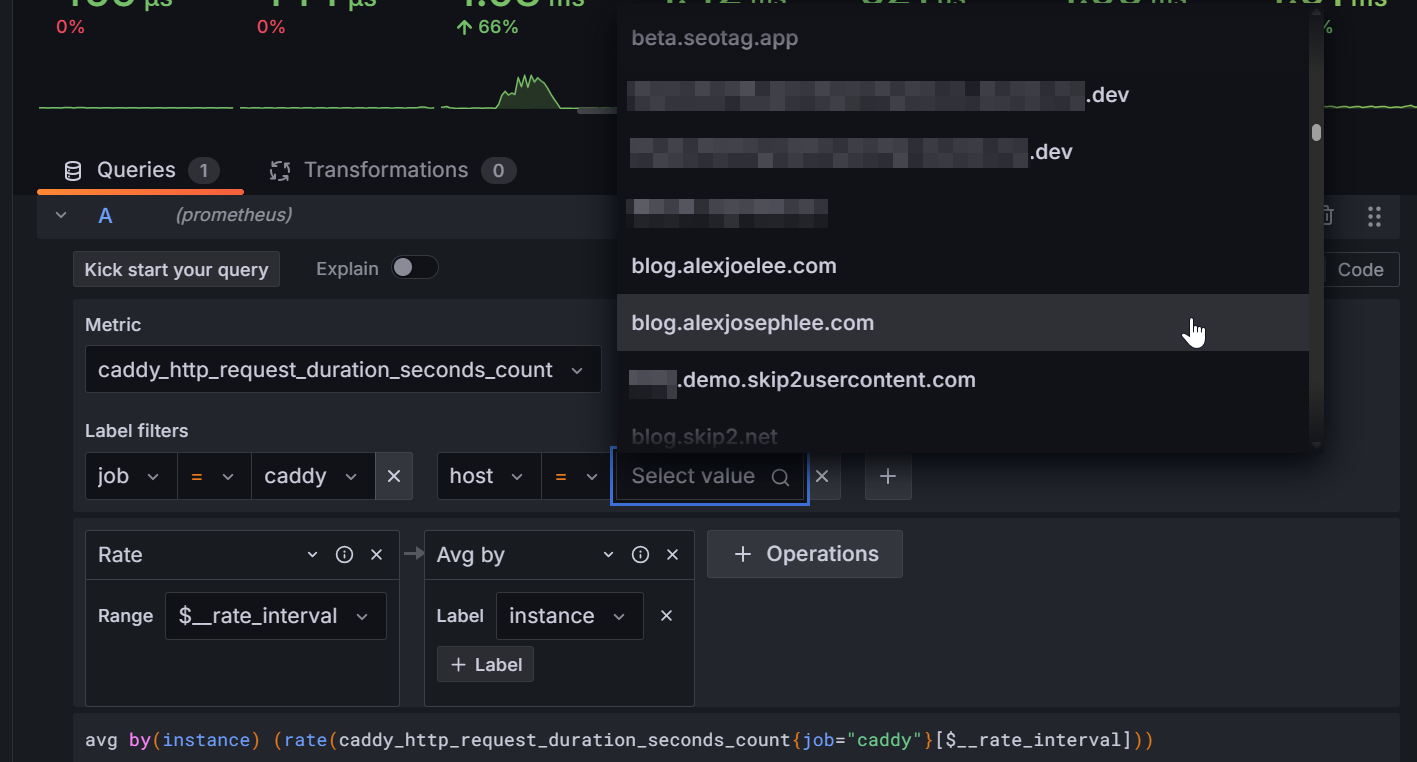
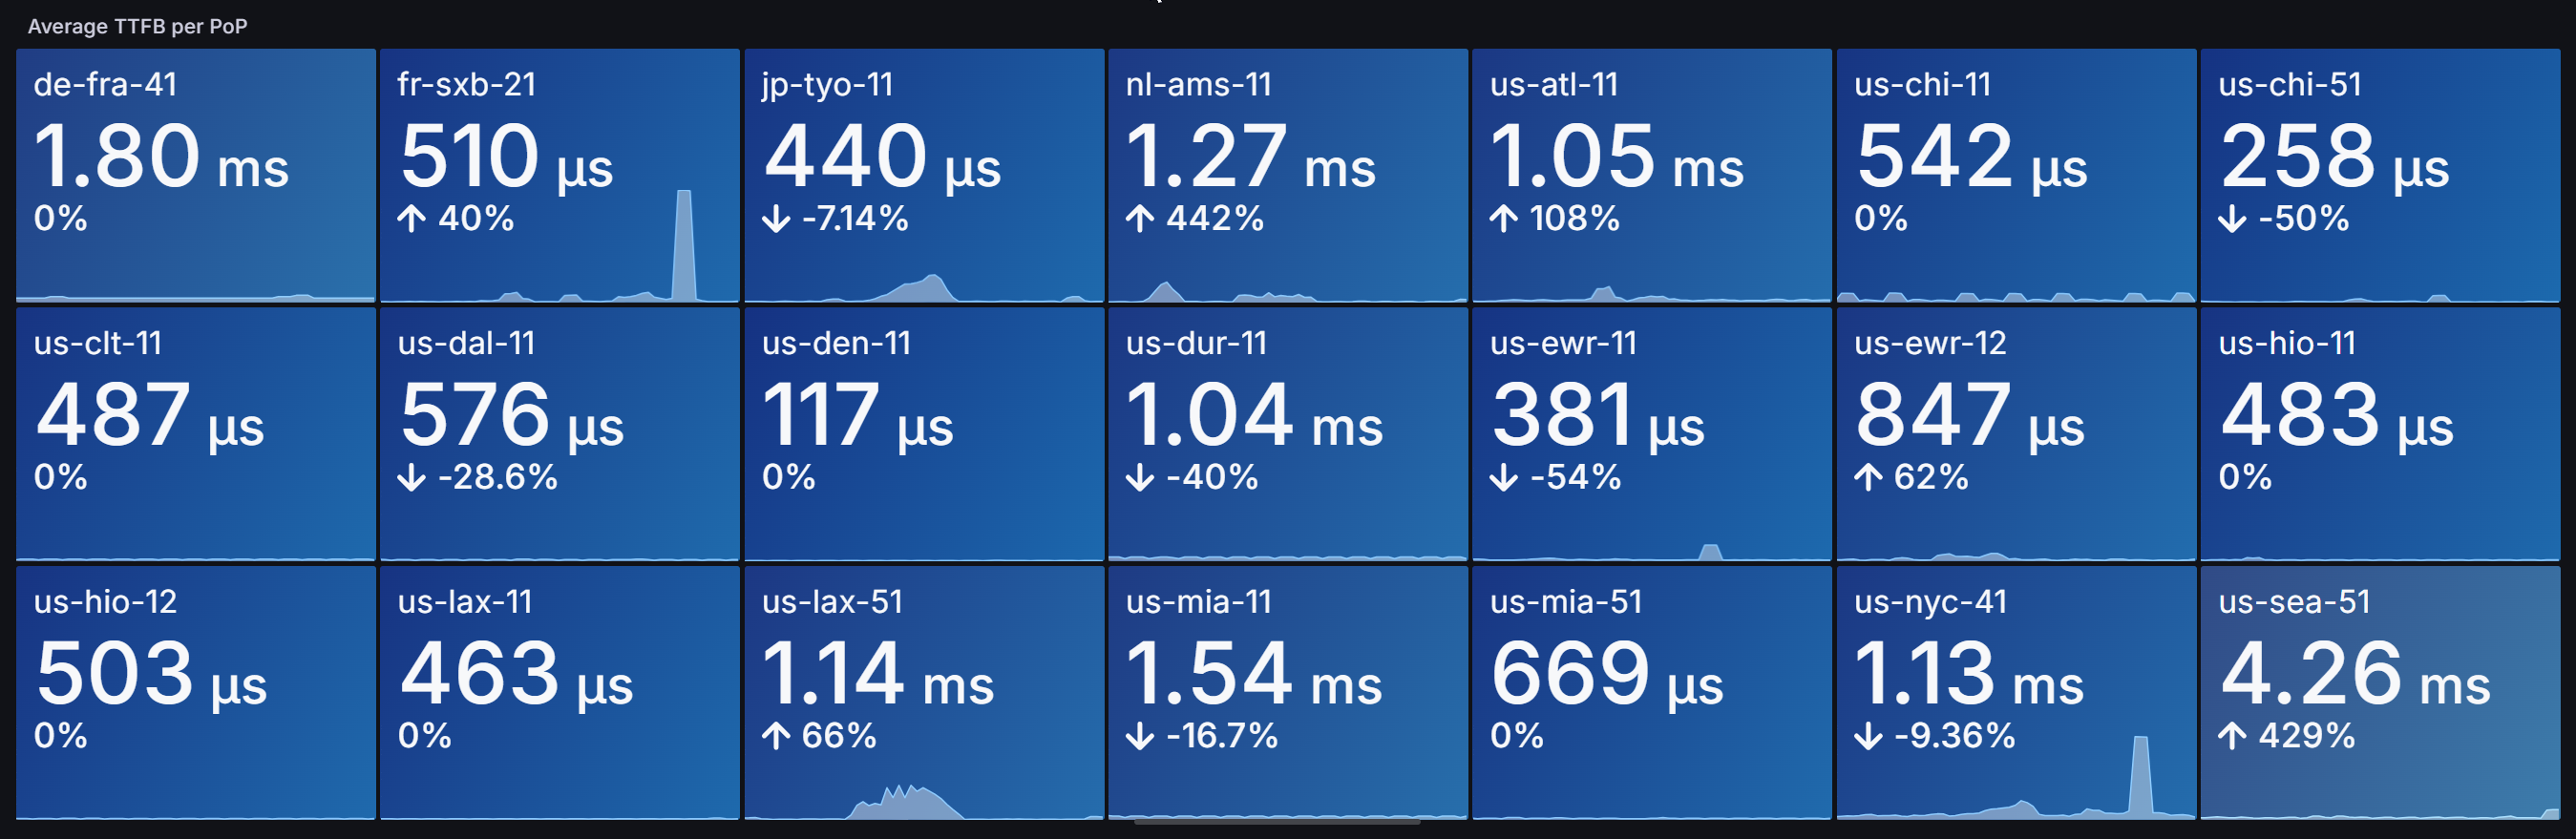
Measuring average TTFB per Server
Create a new panel in Grafana of type Stat
Use this query: avg by(instance) (rate(caddy_http_response_duration_seconds_count{job="caddy"}[$__rate_interval]))
Break it down:
caddy: This is a label selector, filtering the data to only include metrics where the job label has a value of "caddy". This ensures you're looking at metrics specifically from your Caddy instances.
[__rate_interval]: This specifies a time window. rate() needs to know how far back to look to calculate the per-second average. __rate_interval is a variable, common in tools like Grafana, that dynamically sets this duration (e.g., 5 minutes, 1 hour) based on the dashboard's time range.
rate(...): This function calculates the per-second average rate of increase of the counter "caddy_http_response_duration_seconds_count" over the specified time window ($__rate_interval). In simpler terms, it shows you how many Caddy HTTP responses are happening per second.
avg by(instance) (...): This takes the results from the rate function and then averages them. The by(instance) part is crucial: it means the average will be calculated for each unique instance label found in the data. So, if you have multiple Caddy instances, you'll get an average response rate per second for each individual instance.
You should see something like the following screenshot, depending on how many hosts you have:
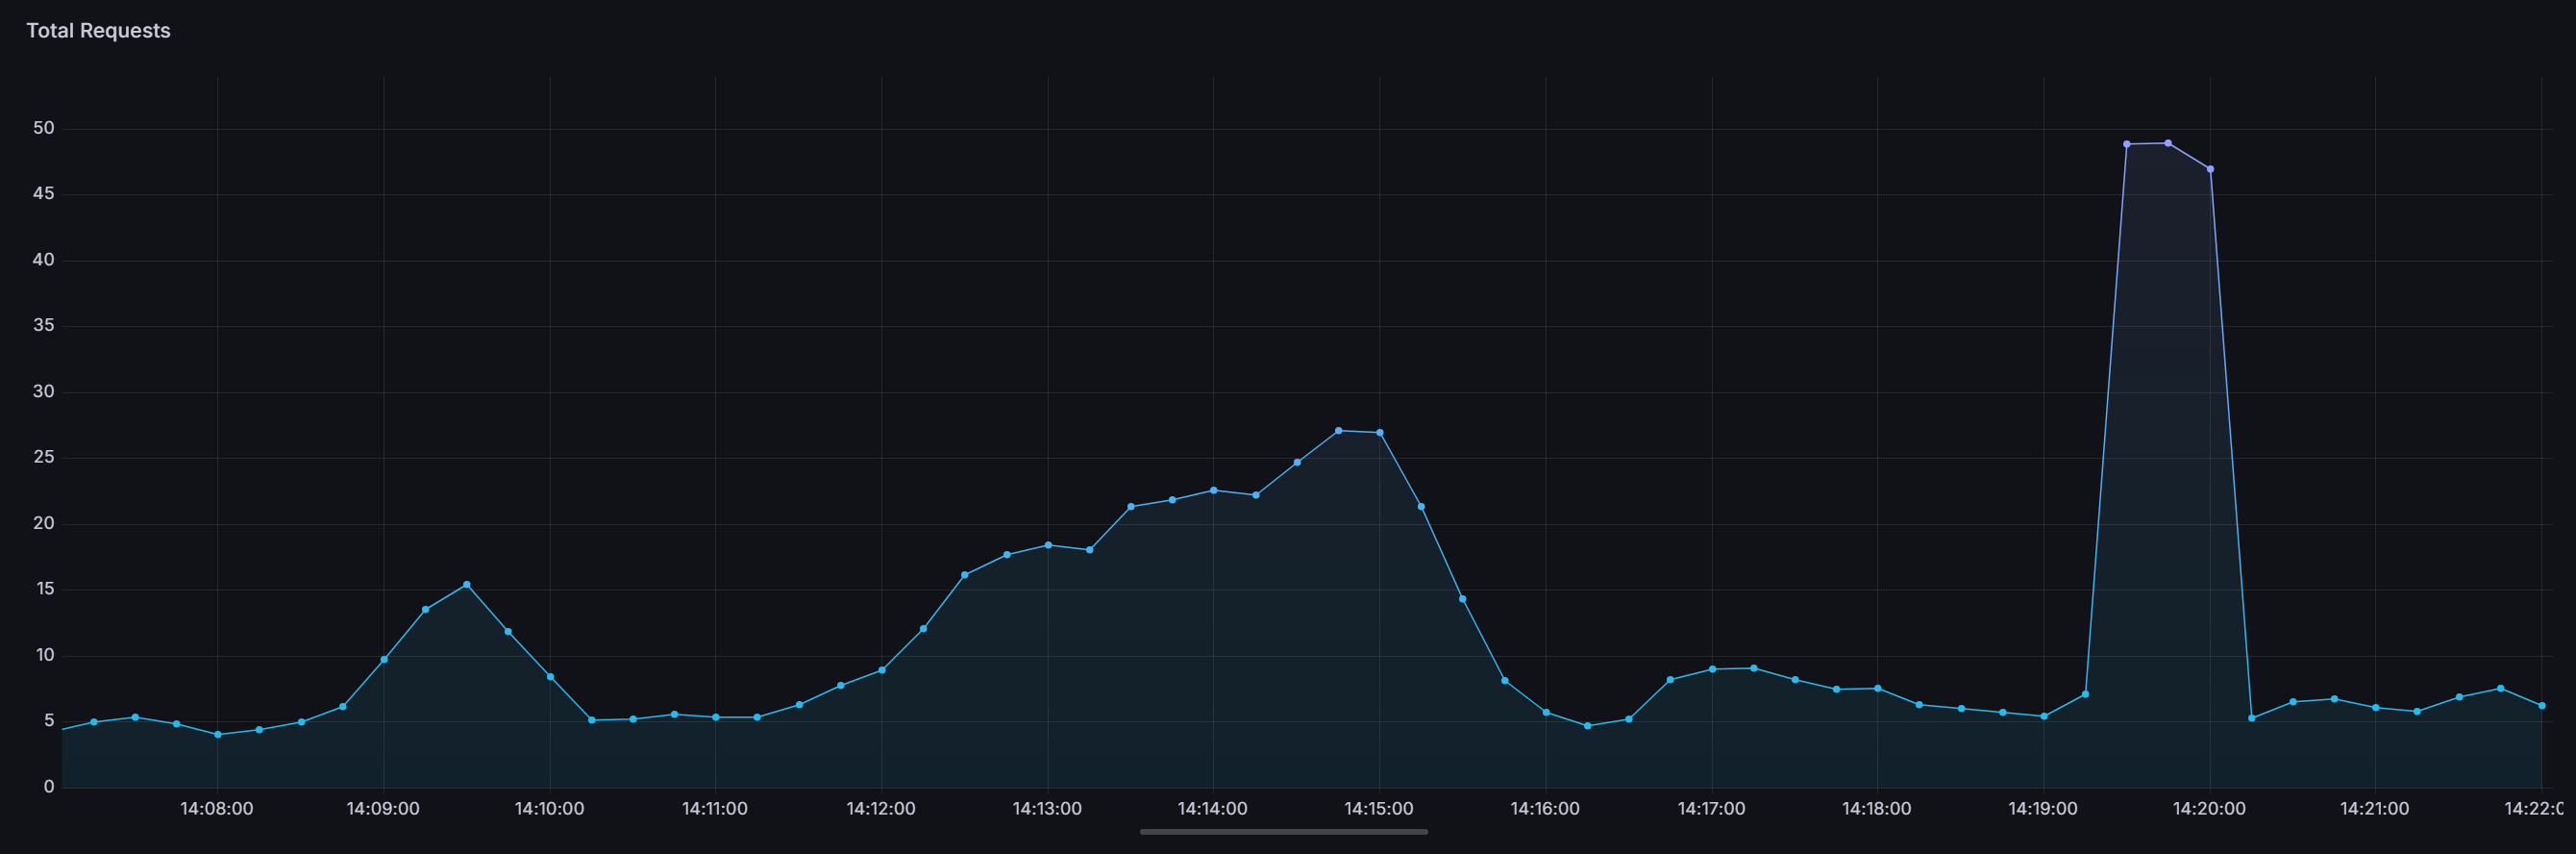
Measuring Total Requests
Create a new panel in Grafana of type Time Series
Use this query: sum by(job) (rate(caddy_http_requests_total{job="caddy"}[$__rate_interval]))
Break it down:
caddy: This is a label selector, again, narrowing down the data to only metrics where the job label is "caddy", focusing solely on your Caddy instances.
[$__rate_interval]: Just like before, this defines the time window over which the rate function will calculate its average. It's a dynamic variable that matches your dashboard's selected time range.
rate(...): This function calculates the per-second average rate of increase of the caddy_http_requests_total counter over the $__rate_interval. So, it's telling you the number of Caddy HTTP requests per second.
sum by(job) (...): This takes the results from the rate function and sums them up. The by(job) part means that after the sum is calculated, the results will be grouped by the job label. Since you've already filtered for job="caddy", this will effectively give you the total requests per second across all your Caddy instances that match that job.
You should see something like the following screenshot, depending on how many requests you've been serving:
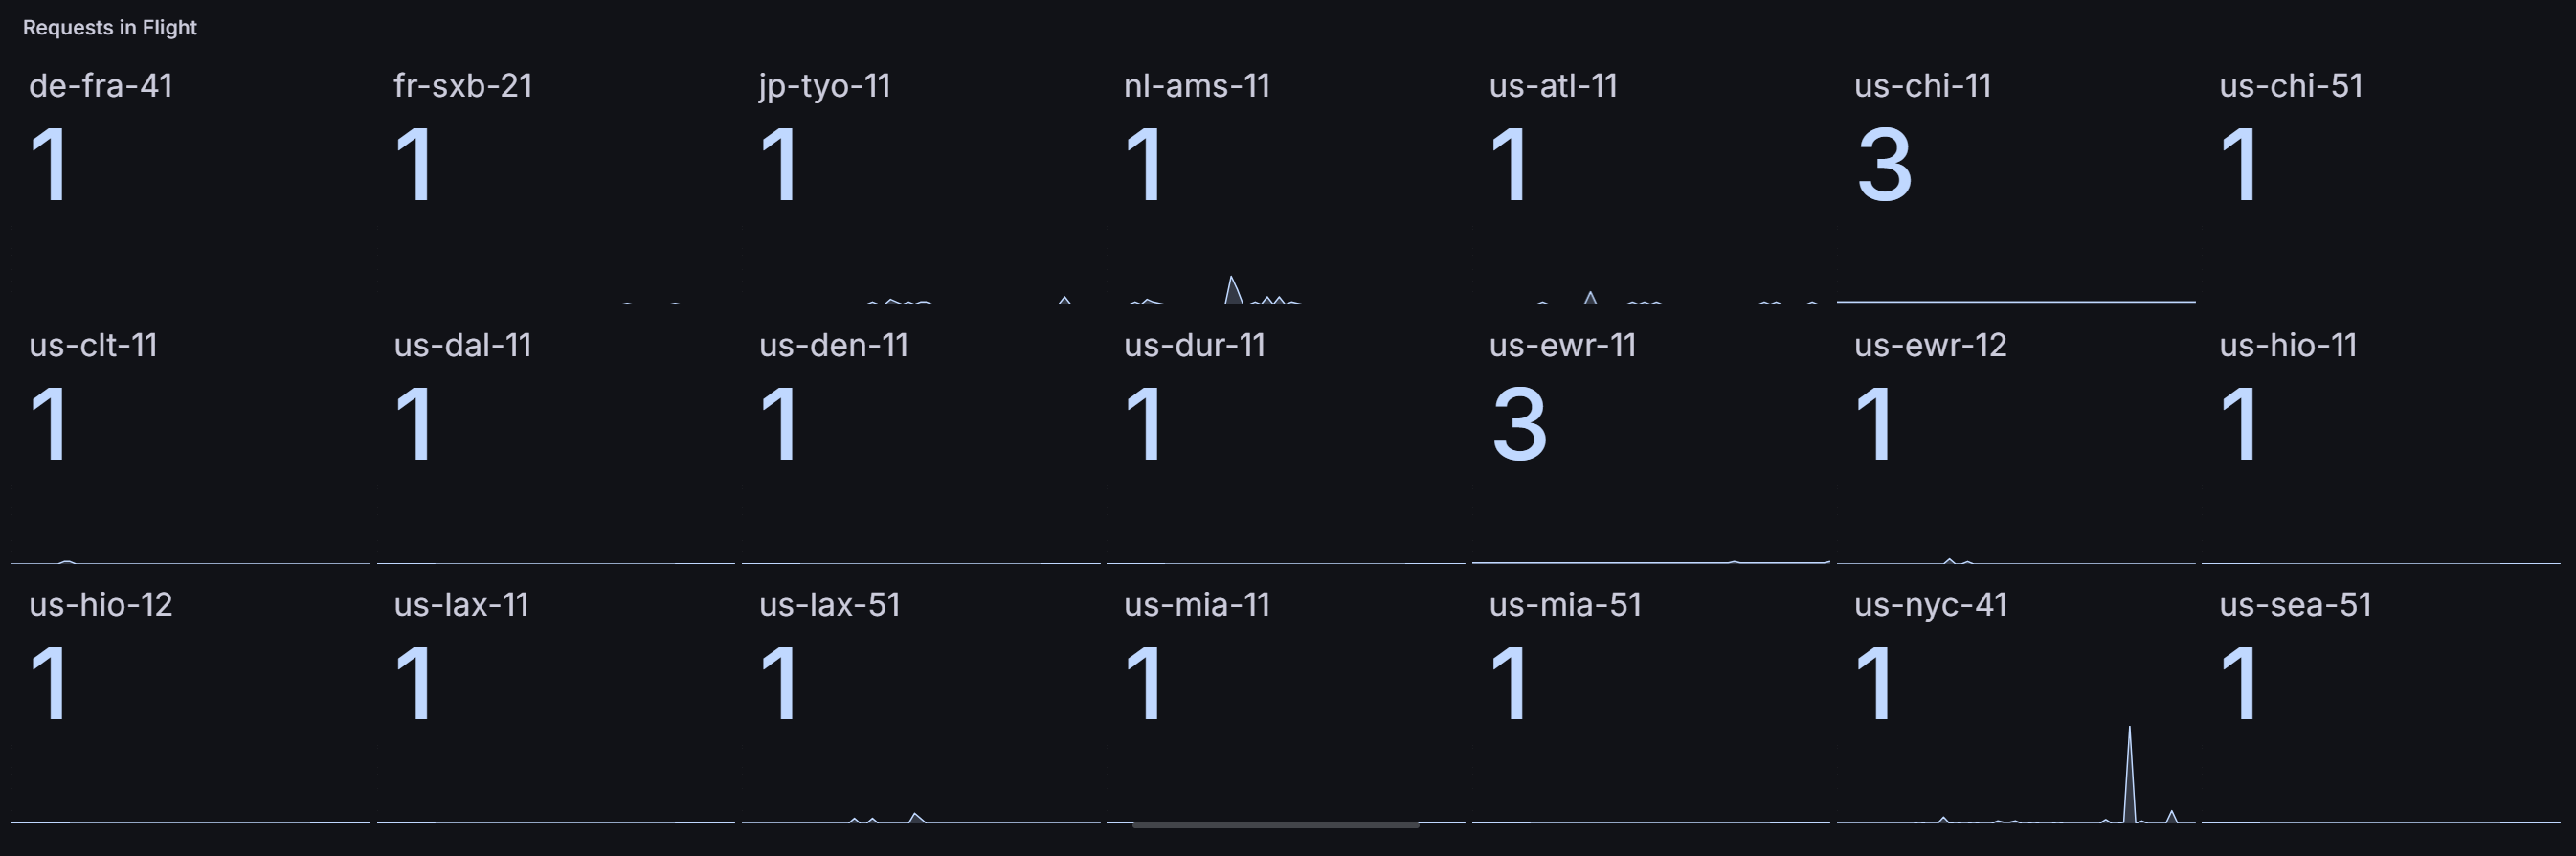
Measuring Requests In Flight
Create a new panel in Grafana of type Stat
Use this query: sum by(instance) (caddy_http_requests_in_flight{job="caddy"})
Break it down:
caddy: This is your label selector, making sure you're only looking at data from your Caddy Web Server instances.
sum by(instance) (...): This takes the values of the caddy_http_requests_in_flight metric and sums them. The by(instance) part means the sum will be calculated for each unique instance label.
You should see something like the following screenshot, depending on how many hosts you have and how busy they are:
Wrapping up
Caddy offers numerous built-in ways to monitor the performance of your servers in real-time. Grafana is the industry-standard tool for visualizing your metrics and creating actionable alerts.
Want to learn more about Caddy?
Visit their official website at caddyserver.com Read through the docs at caddyserver.com/docs If you use it, sponsor the project (we do!) caddyserver.com/sponsor
This post is one of a series of tutorials about Caddy Server. You can view all relevant posts here.