- Published on
Caddy: OpenTelemetry
- Authors

- Name
- Alex Lee
- Title
- CEO
- @alexjoelee
Welcome back! We're going to examine one of the ways that you can monitor Caddy, using OpenTelemetry (OTEL).
What is OpenTelemetry?
OpenTelemetry is a widely adopted open-source observabililty framework that enables developers to export traces from their applications. Traces are events that occur, these are similar to traditional log entries except they provide a more holistic view of where a single request goes through an application.
Exporting Traces from Caddy
Caddy offers OTEL support out-of-the-box. The good news is that it's really easy to set up if you're already running an instance OpenTelemetry Collector or equivalent, such as Grafana Alloy. First, you'll need to set up two environment variables that Caddy can read so it knows how to communicate with your collector instance:
export OTEL_EXPORTER_OTLP_HEADERS="myAuthHeader=myToken"
export OTEL_EXPORTER_OTLP_TRACES_ENDPOINT=https://my-otlp-endpoint:55680
Next, you'll need to add tracing to your Caddyfile. For example:
example.com {
	tracing {
		span api
	}
	request_header X-Trace-Id {http.vars.trace_id}
	reverse_proxy localhost:8081
}
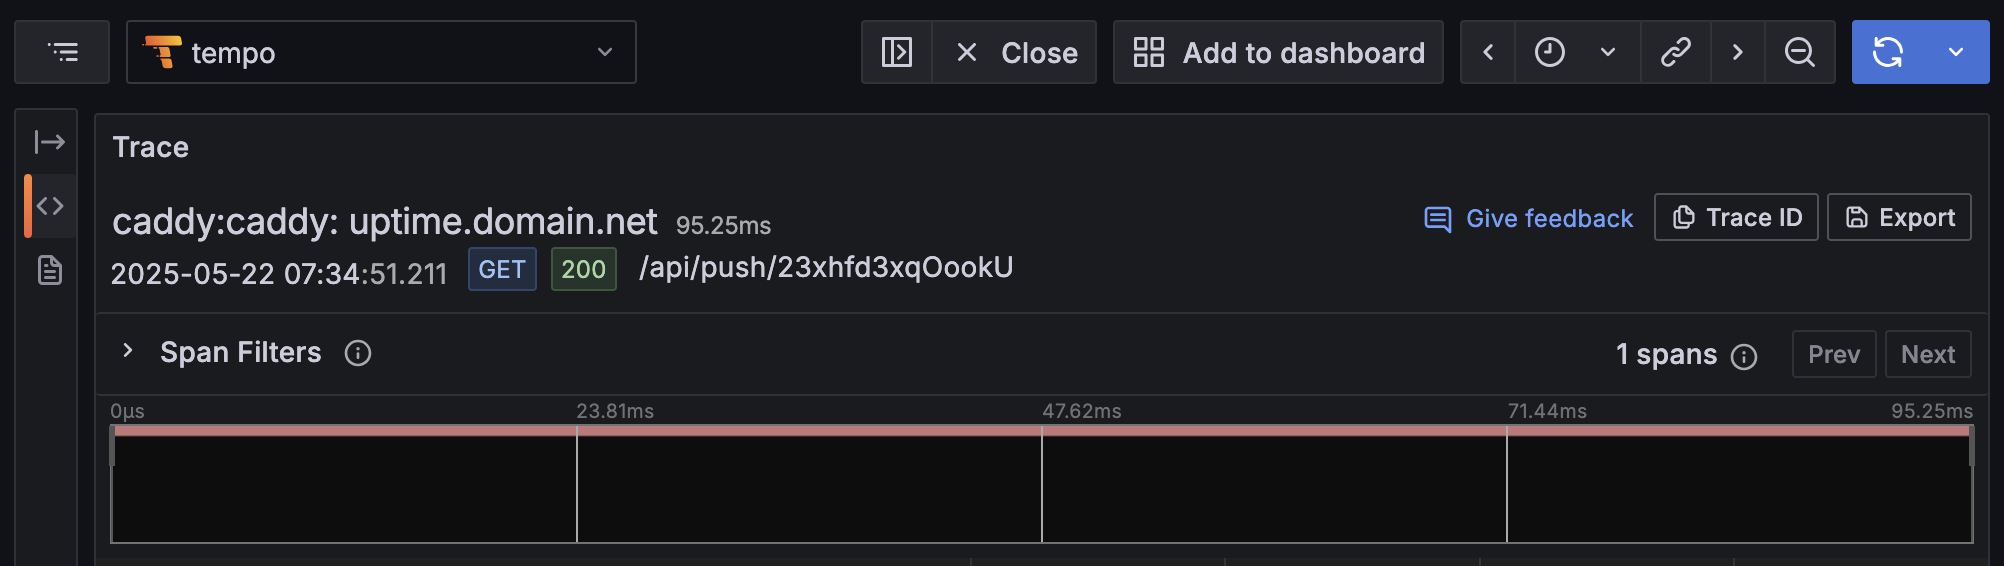
Reload Caddy. With your telemetry pipeline complete, you should be able to log into your Grafana instance and see traces from your collector:
Continue Reading
You can learn more about Caddy's tracing support on Caddy's official documentation site.
You can learn more about OpenTelemetry at OpenTelemetry.io
Wrapping up
OpenTelemetry tracing is a great framework for tracing requests as they travel through your stack. Integrating your web server to your tracing stacks gives nearly end-to-end visibility, making it easy to spot problems when dealing with complex systems.
Want to learn more about Caddy?
Visit their official website at caddyserver.com Read through the docs at caddyserver.com/docs If you use it, sponsor the project (we do!) caddyserver.com/sponsor
This post is one of a series of tutorials about Caddy Server. You can view all relevant posts here.